| Smarter Energy for a Cleaner Future Go-Forward Plan Capstone Green Energy Corporation |
| Smarter Energy for a Cleaner Future 2 Safe Harbor Disclaimer This Presentation and any oral statements made in connection with this Presentation do not constitute an offer to sell, or a solicitation of an offer to buy, or a recommendation to purchase, any securities in any jurisdiction. Forward-Looking Statements This presentation contains “forward-looking statements” within the meaning of the “safe harbor” provisions of the Private Securities Litigation Reform Act of 1995, including but not limited to, statements regarding the financial outlook, business strategy and plans and market trends, opportunities and positioning of Capstone Green Energy Corporation (the “Company,” “Capstone,” “we,” “our” or “us”). These forward-looking statements are based on current expectations, estimates, forecasts and projections. Words such as “expect,” “anticipate,” “should,” “believe,” “hope,” “target,” “project,” “goals,” “estimate,” “potential,” “predict,” “may,” “will,” “might,” “could,” “intend,” “shall” and variations of these terms and similar expressions are intended to identify these forward-looking statements, although not all forward-looking statements contain these identifying words. Forward-looking statements are subject to a number of risks and uncertainties, many of which involve factors or circumstances that are beyond the Company’s control. Actual results, performance and achievements could differ materially from those expressed in, or implied by, these forward-looking statements due to a variety of risks, uncertainties and other factors, including, but not limited to, the following: attendant to the Chapter 11 bankruptcy process, including the Company’s ability to obtain court approval from the Bankruptcy Court with respect to motions or other requests made to the Bankruptcy Court throughout the course of the Chapter 11 process; the effects of Chapter 11, including increased legal and other professional costs necessary to execute the Chapter 11 process and on the Company’s liquidity and results of operations (including the availability of operating capital during the pendency of Chapter 11); the length of time that the Company will operate under Chapter 11 protection and the continued availability of operating capital during the pendency of Chapter 11; the Company’s ability to continue funding operations through the Chapter 11 bankruptcy process, and the possibility that it may be unable to obtain any additional funding as needed; the Company’s ability to meet its financial obligations during the Chapter 11 process and to maintain contracts that are critical to its operations; the Company’s ability to comply with the restrictions imposed by the terms and conditions of the DIP Facility and other financing arrangements; objections to the DIP Facility, or other pleadings filed that could protract Chapter 11; the effects of Chapter 11 on the interests of various constituents and financial stakeholders; the effect of the Chapter 11 filings on the Company’s relationships with vendors, regulatory authorities, employees and other third parties; possible proceedings that may be brought by third parties in connection with the Chapter 11 process and risks associated with third-party motions in Chapter 11; employee attrition and the Company’s ability to retain senior management and other key personnel due to the distractions and uncertainties; the impact and timing of any cost-savings measures and related local law requirements in various jurisdictions; the impact of litigation and regulatory proceedings; risks related to the restatement (including discovery of additional information relevant to the financial statements subject to restatement; changes in the effects of the restatement on the Company’s financial statements or financial results and delay in the filing of the amended 10-K and amended 10-Q’s due to the Company’s efforts to complete the restatement; the time, costs and expenses associated with the restatement; potential inquiries from the SEC and/or Nasdaq; the potential material adverse effect on the price of the Company’s common stock and possible stockholder lawsuits); and expectations regarding financial performance, strategic and operational plans, and other related matters.. Because of the risks and uncertainties, Capstone cautions you not to place undue reliance on these statements, which speak only as of the date of this presentation. For a detailed discussion of factors that could affect the Company's future operating results, please see the Company's filings with the Securities and Exchange Commission, including the disclosures under "Risk Factors" in those filings. There may be additional risks, including risks of which we are not presently aware or that we currently believe are immaterial, which could have an adverse impact on our business. Except as expressly required by the federal securities laws, the Company undertakes no obligation to update or revise any forward-looking statements, whether as a result of new information, changed circumstances or future events, or for any other reason. Use of Projections This Presentation contains financial forecasts with respect to Capstone’s projected financial results. Capstone’s independent auditors have not audited, reviewed, compiled or performed any procedures with respect to the projections for the purpose of their inclusion in this Presentation, and accordingly, they did not express an opinion or provide any other form of assurance with respect thereto for the purpose of this Presentation. These projections should not be relied upon as being necessarily indicative of future results. The assumptions and estimates underlying the prospective financial information are inherently uncertain and are subject to a wide variety of significant business, economic and competitive risks and uncertainties that could cause actual results to differ materially from those contained in the prospective financial information. Accordingly, there can be no assurance that the prospective results are indicative of the future performance of Capstone or that actual results will not differ materially from those presented in the prospective financial information. Inclusion of the prospective financial information in this Presentation should not be regarded as a representation by any person that the results contained in the prospective financial information will be achieved. See “Forward-Looking Statements” above. Non-GAAP Financial Measure To supplement the company’s unaudited financial data presented on a generally accepted accounting principles (GAAP) basis, management has presented Adjusted EBITDA, a non-GAAP financial measure. This non-GAAP financial measure is among the indicators management uses as a basis for evaluating the company’s financial performance as well as for forecasting future periods. Management establishes performance targets, annual budgets and makes operating decisions based in part upon this metric. Accordingly, disclosure of this non-GAAP financial measure provides investors with the same information that management uses to understand the company’s economic performance year-over-year. Adjusted EBITDA is defined as Net Income before interest, depreciation and amortization, non-cash compensation and restructuring related costs. Adjusted EBITDA is not a measure of the company’s liquidity or financial performance under GAAP and should not be considered as an alternative to net income or any other performance measure derived in accordance with GAAP, or as an alternative to cash flows from operating activities as a measure of its liquidity. While management believes that the non-GAAP financial measure provides useful supplemental information to investors, there are limitations associated with the use of this measure. The measures are not prepared in accordance with GAAP and may not be directly comparable to similarly titled measures of other companies due to potential differences in the methods of calculation. Management compensates for these limitations by relying primarily on the company’s GAAP results and by using Adjusted EBITDA only supplementally. Non-GAAP financial measures are not in accordance with generally accepted accounting principles in the United States. The company’s non-GAAP financial measures are not meant to be considered in isolation or as a substitute for comparable GAAP financial measures and should be read only in conjunction with the company’s consolidated financial statements prepared in accordance with GAAP. |
| Smarter Energy for a Cleaner Future 3 Agenda ▪ Company History ▪ Restructuring Overview ▪ 10-K & 10-Q Update ▪ Capitalization, Projections, & Valuations ▪ Market Outlook ▪ Going Forward ▪ Q&A |
| Smarter Energy for a Cleaner Future Company History 4 Robert Flexon Executive Chairman Interim President & Chief Executive Officer |
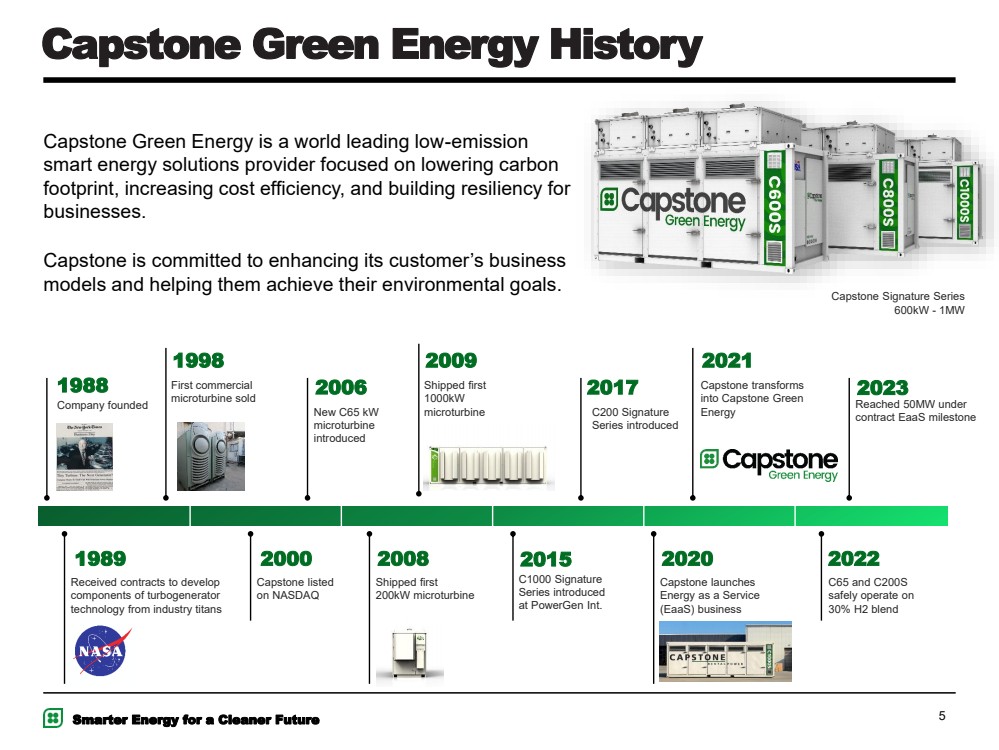
| Smarter Energy for a Cleaner Future 5 Capstone Green Energy History Capstone Green Energy is a world leading low-emission smart energy solutions provider focused on lowering carbon footprint, increasing cost efficiency, and building resiliency for businesses. Capstone is committed to enhancing its customer’s business models and helping them achieve their environmental goals. 1989 1988 1998 2000 2006 2008 2022 Received contracts to develop components of turbogenerator technology from industry titans Company founded Capstone listed on NASDAQ First commercial microturbine sold New C65 kW microturbine introduced Shipped first 200kW microturbine 2009 Shipped first 1000kW microturbine 2017 2020 Capstone launches Energy as a Service (EaaS) business C65 and C200S safely operate on 30% H2 blend 2023 Reached 50MW under contract EaaS milestone Capstone Signature Series 600kW - 1MW 2015 C1000 Signature Series introduced at PowerGen Int. 2021 Capstone transforms into Capstone Green C200 Signature Energy Series introduced |
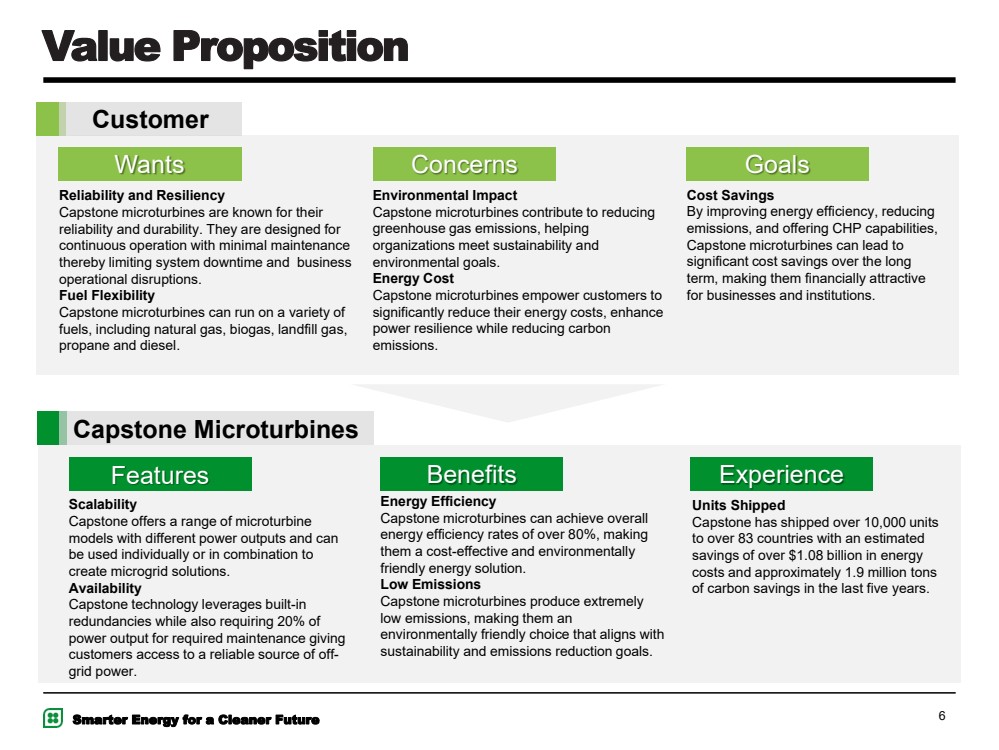
| Smarter Energy for a Cleaner Future 6 Value Proposition Features Benefits Experience Capstone Microturbines Wants Concerns Goals Customer Reliability and Resiliency Capstone microturbines are known for their reliability and durability. They are designed for continuous operation with minimal maintenance thereby limiting system downtime and business operational disruptions. Fuel Flexibility Capstone microturbines can run on a variety of fuels, including natural gas, biogas, landfill gas, propane and diesel. Cost Savings By improving energy efficiency, reducing emissions, and offering CHP capabilities, Capstone microturbines can lead to significant cost savings over the long term, making them financially attractive for businesses and institutions. Environmental Impact Capstone microturbines contribute to reducing greenhouse gas emissions, helping organizations meet sustainability and environmental goals. Energy Cost Capstone microturbines empower customers to significantly reduce their energy costs, enhance power resilience while reducing carbon emissions. Energy Efficiency Capstone microturbines can achieve overall energy efficiency rates of over 80%, making them a cost-effective and environmentally friendly energy solution. Low Emissions Capstone microturbines produce extremely low emissions, making them an environmentally friendly choice that aligns with sustainability and emissions reduction goals. Scalability Capstone offers a range of microturbine models with different power outputs and can be used individually or in combination to create microgrid solutions. Availability Capstone technology leverages built-in redundancies while also requiring 20% of power output for required maintenance giving customers access to a reliable source of off-grid power. Units Shipped Capstone has shipped over 10,000 units to over 83 countries with an estimated savings of over $1.08 billion in energy costs and approximately 1.9 million tons of carbon savings in the last five years. |
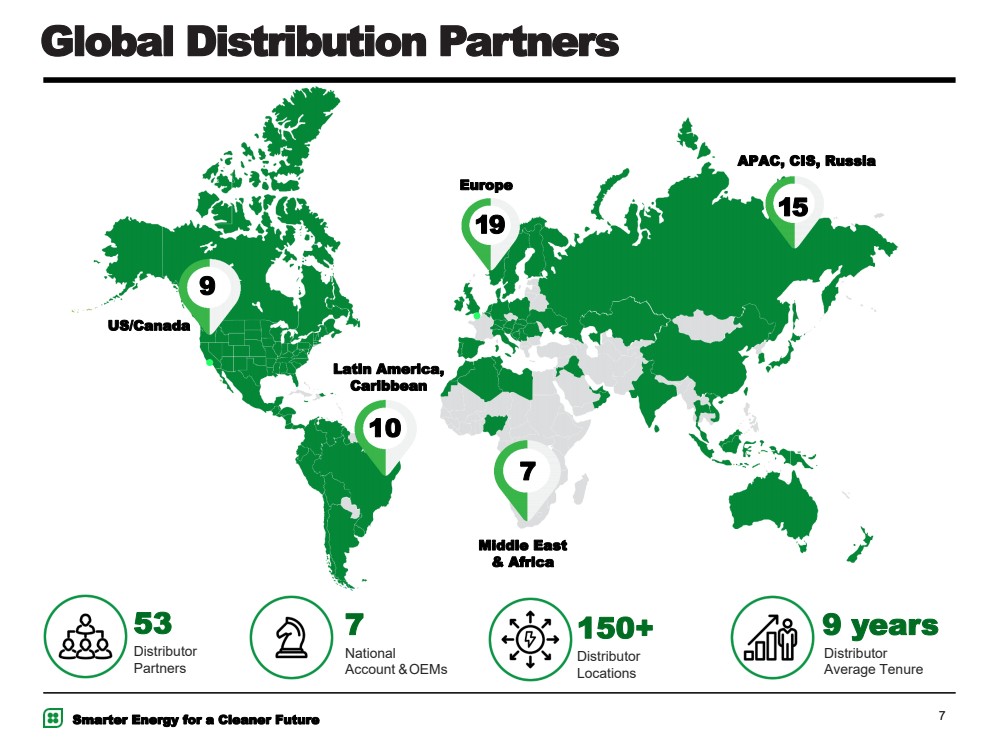
| Smarter Energy for a Cleaner Future 7 Global Distribution Partners 53 Distributor Partners 7 National Account & OEMs 150+ Distributor Locations 9 years Distributor Average Tenure US/Canada Latin America, Caribbean APAC, CIS, Russia Middle East & Africa Europe 7 19 9 10 15 |
| Smarter Energy for a Cleaner Future Restructuring Overview 8 Robert Flexon Executive Chairman Interim President & Chief Executive Officer |
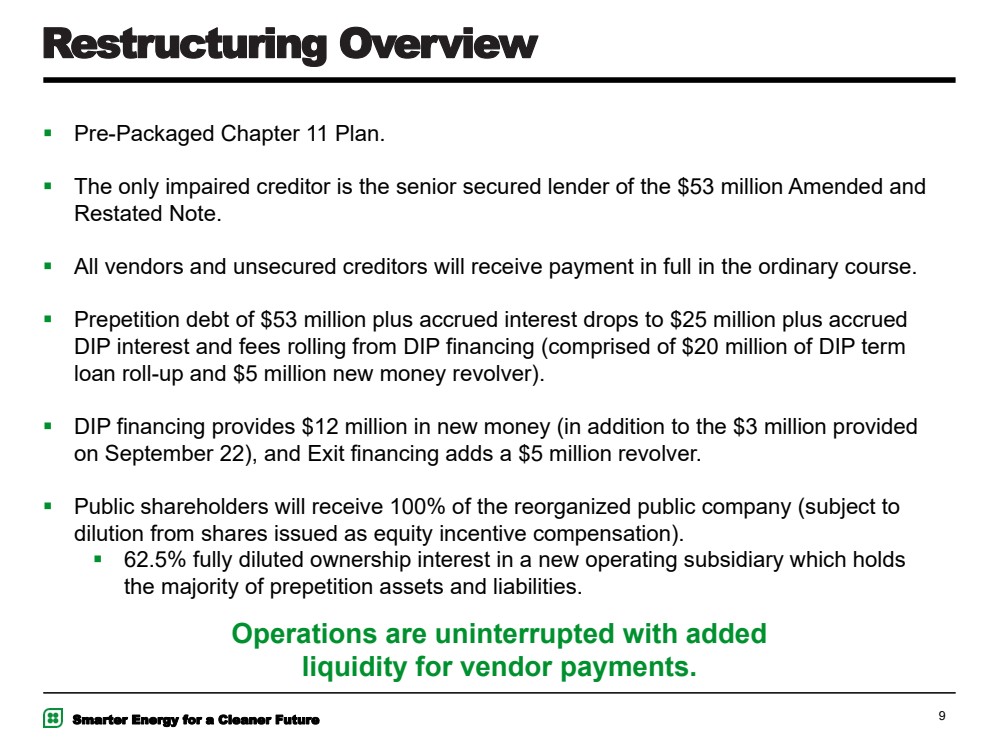
| Smarter Energy for a Cleaner Future 9 Restructuring Overview ▪ Pre-Packaged Chapter 11 Plan. ▪ The only impaired creditor is the senior secured lender of the $53 million Amended and Restated Note. ▪ All vendors and unsecured creditors will receive payment in full in the ordinary course. ▪ Prepetition debt of $53 million plus accrued interest drops to $25 million plus accrued DIP interest and fees rolling from DIP financing (comprised of $20 million of DIP term loan roll-up and $5 million new money revolver). ▪ DIP financing provides $12 million in new money (in addition to the $3 million provided on September 22), and Exit financing adds a $5 million revolver. ▪ Public shareholders will receive 100% of the reorganized public company (subject to dilution from shares issued as equity incentive compensation). ▪ 62.5% fully diluted ownership interest in a new operating subsidiary which holds the majority of prepetition assets and liabilities. Operations are uninterrupted with added liquidity for vendor payments. |
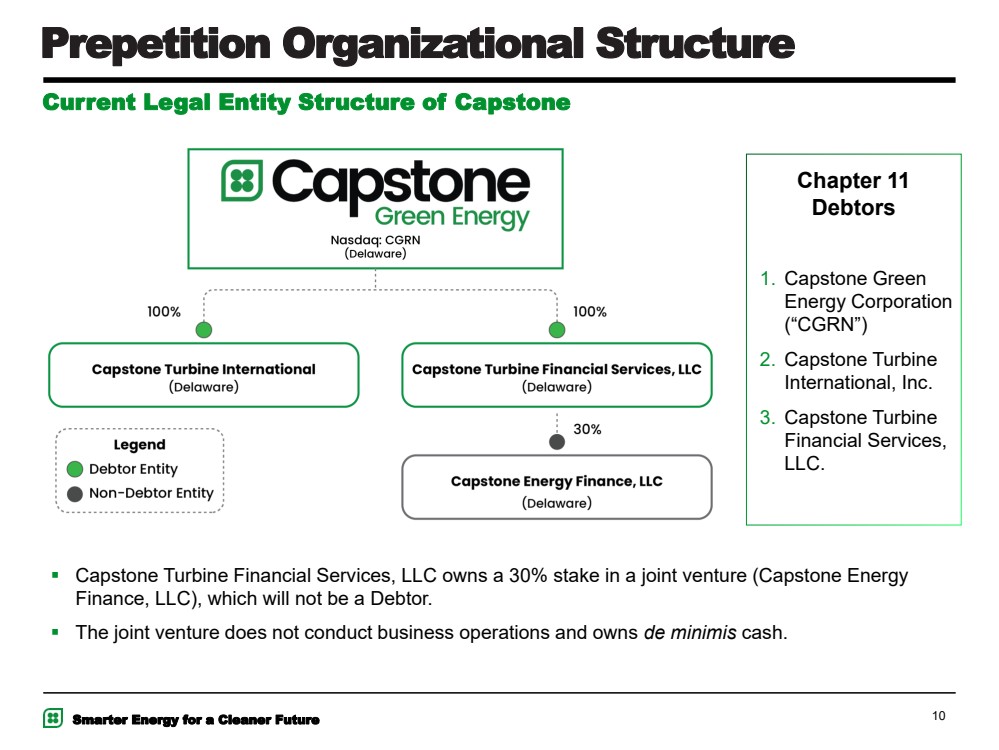
| Smarter Energy for a Cleaner Future ▪ Capstone Turbine Financial Services, LLC owns a 30% stake in a joint venture (Capstone Energy Finance, LLC), which will not be a Debtor. ▪ The joint venture does not conduct business operations and owns de minimis cash. 10 Prepetition Organizational Structure Current Legal Entity Structure of Capstone Chapter 11 Debtors 1. Capstone Green Energy Corporation (“CGRN”) 2. Capstone Turbine International, Inc. 3. Capstone Turbine Financial Services, LLC. |
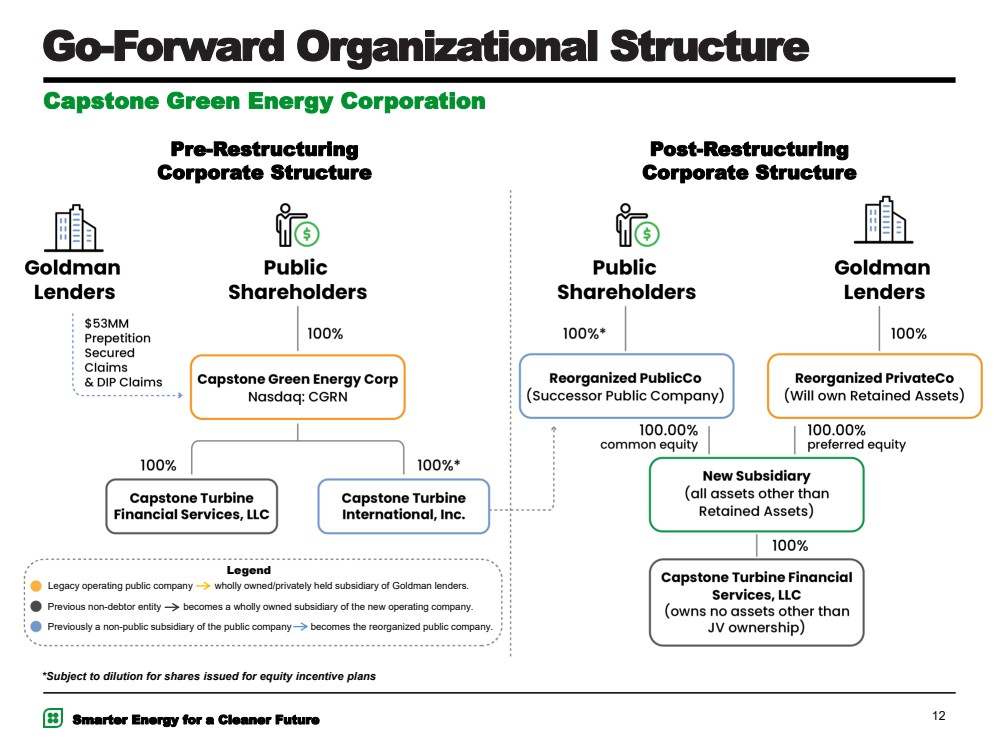
| Smarter Energy for a Cleaner Future ▪ Capstone will effectuate a series of restructuring transactions (the “Restructuring Transactions”) in connection with the Chapter 11 Cases. ▪ Capstone will form a new entity to be the operating company, referred to as “New Subsidiary.” ▪ Capstone Turbine International, Inc. expects to succeed CGRN as the public company reporting with the Securities & Exchange Commission, referred to herein as “Reorganized PublicCo.” ▪ Public Shareholders will receive 100% of the equity in Reorganized PublicCo (subject to dilution from shares issued as equity compensation), which will in turn own 100% of the common equity of New Subsidiary, which will be equivalent to 62.5% of the total equity when fully diluted. All other existing equity interests of the Company, including warrants, options, restricted stock units and performance stock units, will be canceled. ▪ Goldman Lenders, through Broad Street Credit Holdings, LLC, as purchaser of $53 million of Capstone’s senior secured notes (“Purchaser”) and provider of the Capstone’s debtor-in-possession financing facility, will equitize a portion of its secured claim and a portion of the DIP claim into 100% of the preferred units in New Subsidiary, which will be equivalent to 37.5% of the common equity when fully diluted. ▪ Purchaser’s holdings of New Subsidiary’s preferred units will be held by the former CGRN entity and will be converted to a private company, referred to as “Reorganized PrivateCo,” which will keep the “Retained Assets,” which include the right to use the name “Capstone” and all assets related to distributor support services. Restructuring Transaction Steps 11 |
| Smarter Energy for a Cleaner Future Pre-Restructuring Corporate Structure Post-Restructuring Corporate Structure 12 Go-Forward Organizational Structure Capstone Green Energy Corporation Legacy operating public company wholly owned/privately held subsidiary of Goldman lenders. Previous non-debtor entity becomes a wholly owned subsidiary of the new operating company. Previously a non-public subsidiary of the public company becomes the reorganized public company. Legend *Subject to dilution for shares issued for equity incentive plans |
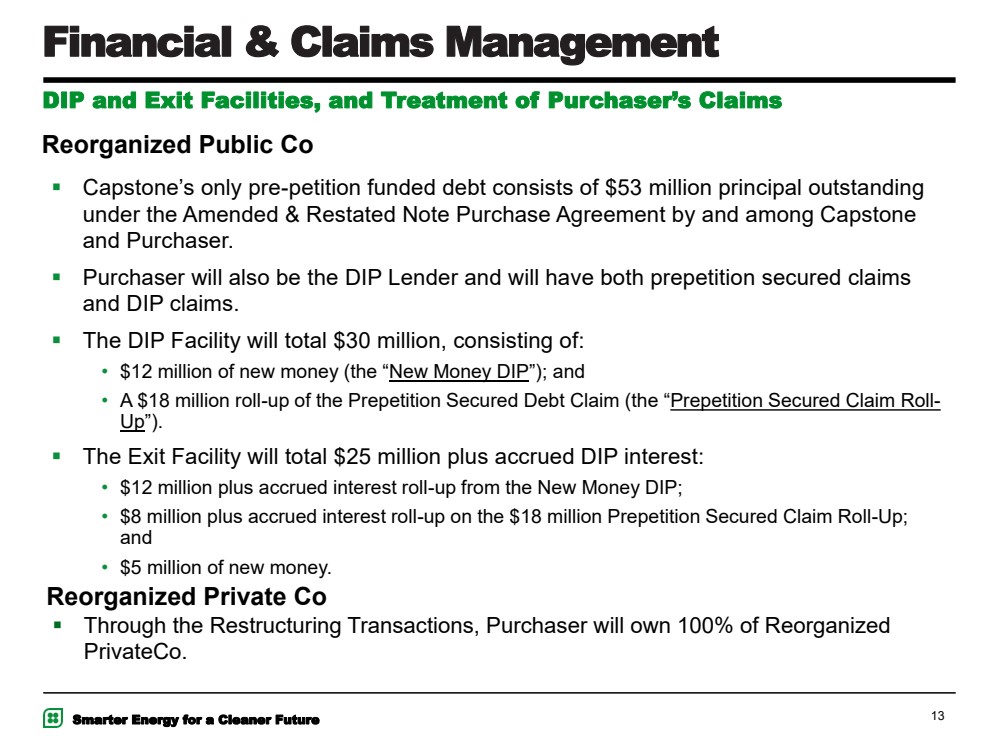
| Smarter Energy for a Cleaner Future ▪ Capstone’s only pre-petition funded debt consists of $53 million principal outstanding under the Amended & Restated Note Purchase Agreement by and among Capstone and Purchaser. ▪ Purchaser will also be the DIP Lender and will have both prepetition secured claims and DIP claims. ▪ The DIP Facility will total $30 million, consisting of: • $12 million of new money (the “New Money DIP”); and • A $18 million roll-up of the Prepetition Secured Debt Claim (the “Prepetition Secured Claim Roll-Up”). ▪ The Exit Facility will total $25 million plus accrued DIP interest: • $12 million plus accrued interest roll-up from the New Money DIP; • $8 million plus accrued interest roll-up on the $18 million Prepetition Secured Claim Roll-Up; and • $5 million of new money. DIP and Exit Facilities, and Treatment of Purchaser’s Claims Financial & Claims Management 13 Reorganized Public Co Reorganized Private Co ▪ Through the Restructuring Transactions, Purchaser will own 100% of Reorganized PrivateCo. |
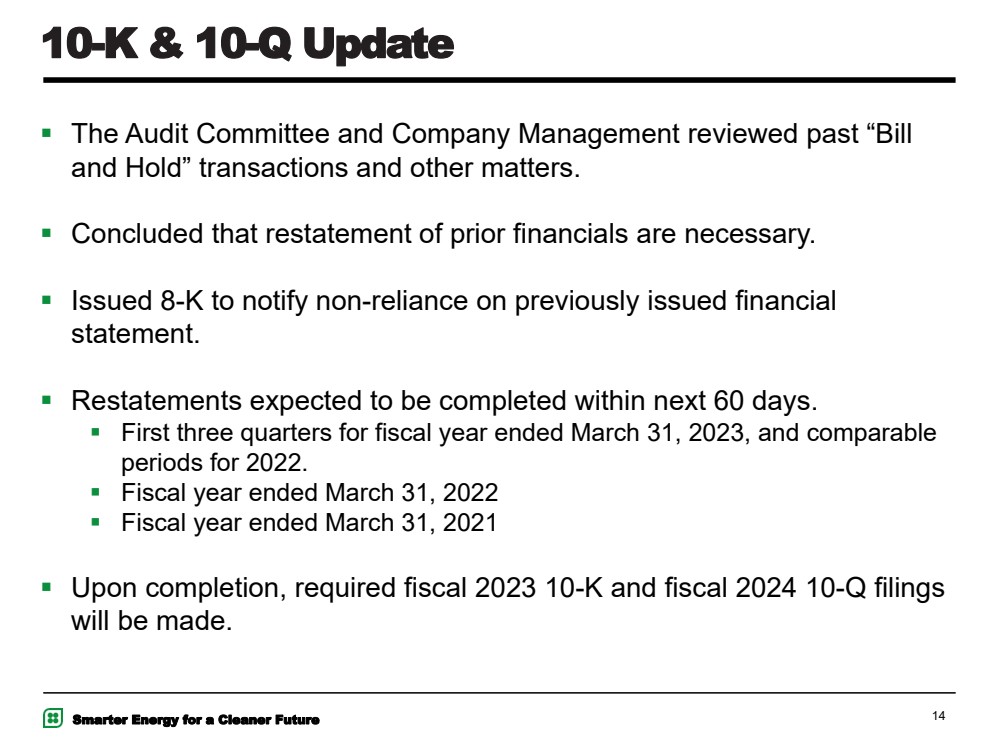
| Smarter Energy for a Cleaner Future 14 10-K & 10-Q Update ▪ The Audit Committee and Company Management reviewed past “Bill and Hold” transactions and other matters. ▪ Concluded that restatement of prior financials are necessary. ▪ Issued 8-K to notify non-reliance on previously issued financial statement. ▪ Restatements expected to be completed within next 60 days. ▪ First three quarters for fiscal year ended March 31, 2023, and comparable periods for 2022. ▪ Fiscal year ended March 31, 2022 ▪ Fiscal year ended March 31, 2021 ▪ Upon completion, required fiscal 2023 10-K and fiscal 2024 10-Q filings will be made. |
| Smarter Energy for a Cleaner Future Capitalization, Projections, & Valuation John Juric Chief Financial Officer |
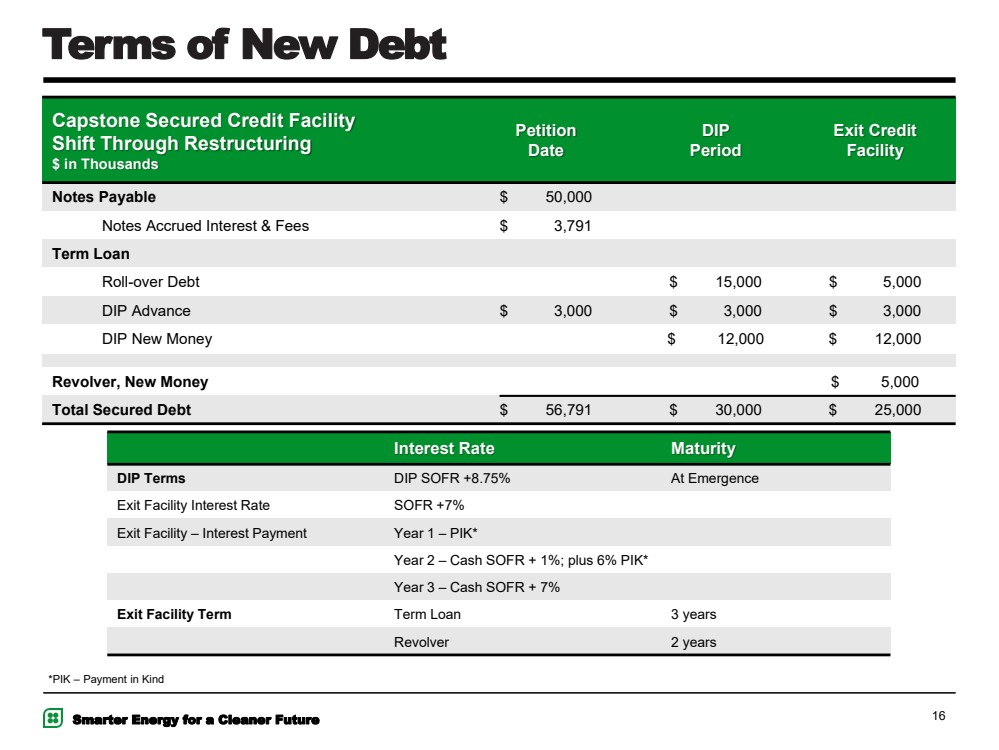
| Smarter Energy for a Cleaner Future 16 Terms of New Debt Capstone Secured Credit Facility Shift Through Restructuring $ in Thousands Petition Date DIP Period Exit Credit Facility Notes Payable $ 50,000 Notes Accrued Interest & Fees $ 3,791 Term Loan Roll-over Debt $ 15,000 $ 5,000 DIP Advance $ 3,000 $ 3,000 $ 3,000 DIP New Money $ 12,000 $ 12,000 Revolver, New Money $ 5,000 Total Secured Debt $ 56,791 $ 30,000 $ 25,000 Interest Rate Maturity DIP Terms DIP SOFR +8.75% At Emergence Exit Facility Interest Rate SOFR +7% Exit Facility – Interest Payment Year 1 – PIK* Year 2 – Cash SOFR + 1%; plus 6% PIK* Year 3 – Cash SOFR + 7% Exit Facility Term Term Loan 3 years Revolver 2 years *PIK – Payment in Kind |
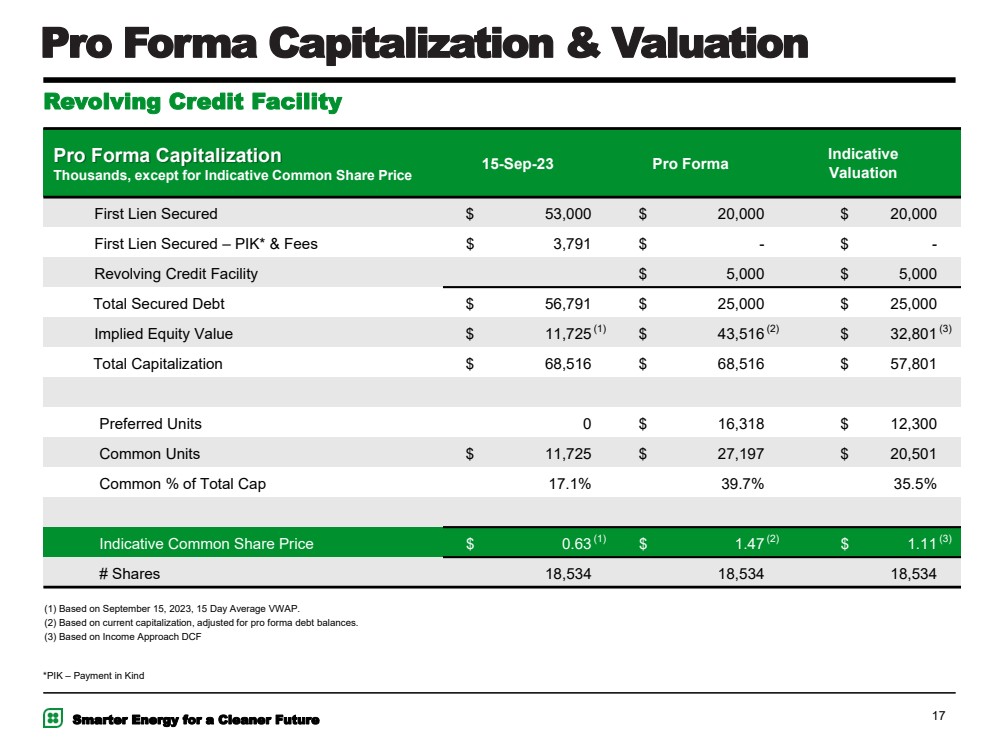
| Smarter Energy for a Cleaner Future 17 Revolving Credit Facility (1) Based on September 15, 2023, 15 Day Average VWAP. (2) Based on current capitalization, adjusted for pro forma debt balances. (3) Based on Income Approach DCF Pro Forma Capitalization & Valuation Pro Forma Capitalization Thousands, except for Indicative Common Share Price 15-Sep-23 Pro Forma Indicative Valuation First Lien Secured $ 53,000 $ 20,000 $ 20,000 First Lien Secured – PIK* & Fees $ 3,791 $ - $ - Revolving Credit Facility $ 5,000 $ 5,000 Total Secured Debt $ 56,791 $ 25,000 $ 25,000 Implied Equity Value $ 11,725 (1) $ 43,516 (2) $ 32,801 (3) Total Capitalization $ 68,516 $ 68,516 $ 57,801 Preferred Units 0 $ 16,318 $ 12,300 Common Units $ 11,725 $ 27,197 $ 20,501 Common % of Total Cap 17.1% 39.7% 35.5% Indicative Common Share Price $ 0.63 (1) $ 1.47 (2) $ 1.11 (3) # Shares 18,534 18,534 18,534 *PIK – Payment in Kind |
| Smarter Energy for a Cleaner Future 18 Preferred Units Terms ▪ Reorganized PrivateCo will be issued Preferred Units of New Subsidiary ▪ Will represent 37.5% of the Equity Value ▪ Non-dilutable ▪ Rank senior to Common Units ▪ Certain Approval Rights ▪ The estimated Purchase Price of Preferred Equity $12.3 million ▪ The Purchase Price will be the required minimum redemption value ▪ Redemption rights in six years for a six month period ▪ Greater of Purchase Price + unpaid dividends or ▪ FMV of the Preferred Units on an as converted to common basis ▪ Other Entitlements ▪ No regular dividends except in limited circumstances ▪ Receive dividends as and if declared on Common Units ▪ Preemptive Rights, subject to customary exceptions ▪ Liquidation preference, greater of ▪ Purchase Price + unpaid dividends, if any or ▪ As converted to Common Liquidation Value |
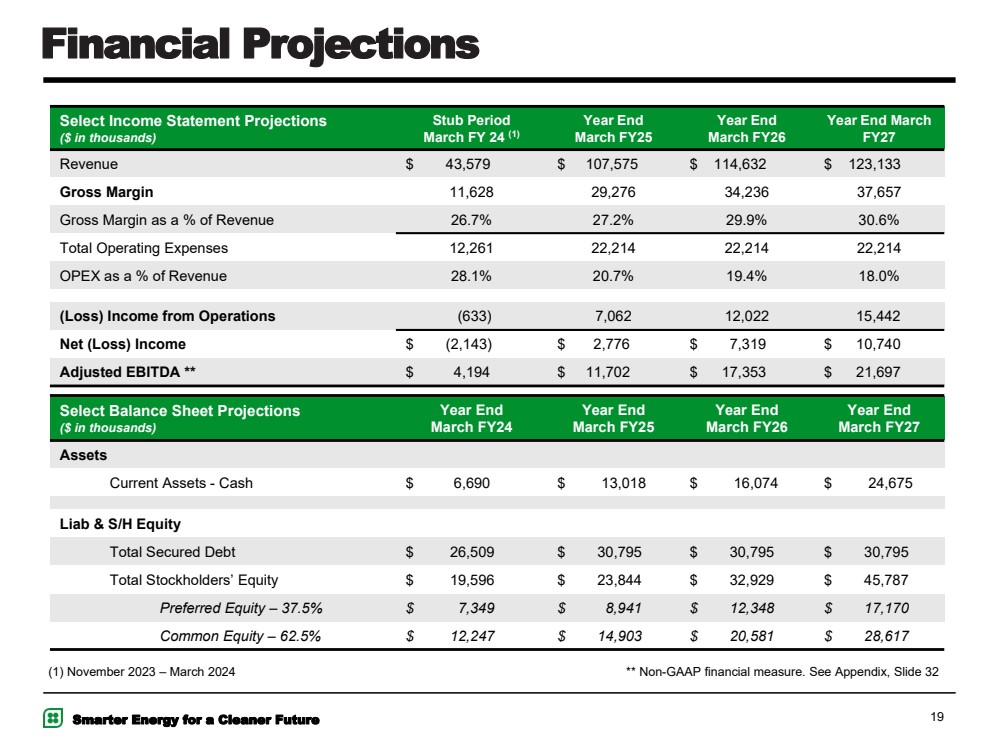
| Smarter Energy for a Cleaner Future Select Income Statement Projections ($ in thousands) Stub Period March FY 24 (1) Year End March FY25 Year End March FY26 Year End March FY27 Revenue $ 43,579 $ 107,575 $ 114,632 $ 123,133 Gross Margin 11,628 29,276 34,236 37,657 Gross Margin as a % of Revenue 26.7% 27.2% 29.9% 30.6% Total Operating Expenses 12,261 22,214 22,214 22,214 OPEX as a % of Revenue 28.1% 20.7% 19.4% 18.0% (Loss) Income from Operations (633) 7,062 12,022 15,442 Net (Loss) Income $ (2,143) $ 2,776 $ 7,319 $ 10,740 Adjusted EBITDA ** $ 4,194 $ 11,702 $ 17,353 $ 21,697 ** Non-GAAP financial measure. See Appendix, Slide 32 19 Financial Projections Select Balance Sheet Projections ($ in thousands) Year End March FY24 Year End March FY25 Year End March FY26 Year End March FY27 Assets Current Assets - Cash $ 6,690 $ 13,018 $ 16,074 $ 24,675 Liab & S/H Equity Total Secured Debt $ 26,509 $ 30,795 $ 30,795 $ 30,795 Total Stockholders’ Equity $ 19,596 $ 23,844 $ 32,929 $ 45,787 Preferred Equity – 37.5% $ 7,349 $ 8,941 $ 12,348 $ 17,170 Common Equity – 62.5% $ 12,247 $ 14,903 $ 20,581 $ 28,617 (1) November 2023 – March 2024 |
| Smarter Energy for a Cleaner Future Jen Derstine Vice President of Marketing & Distribution Market Outlook |
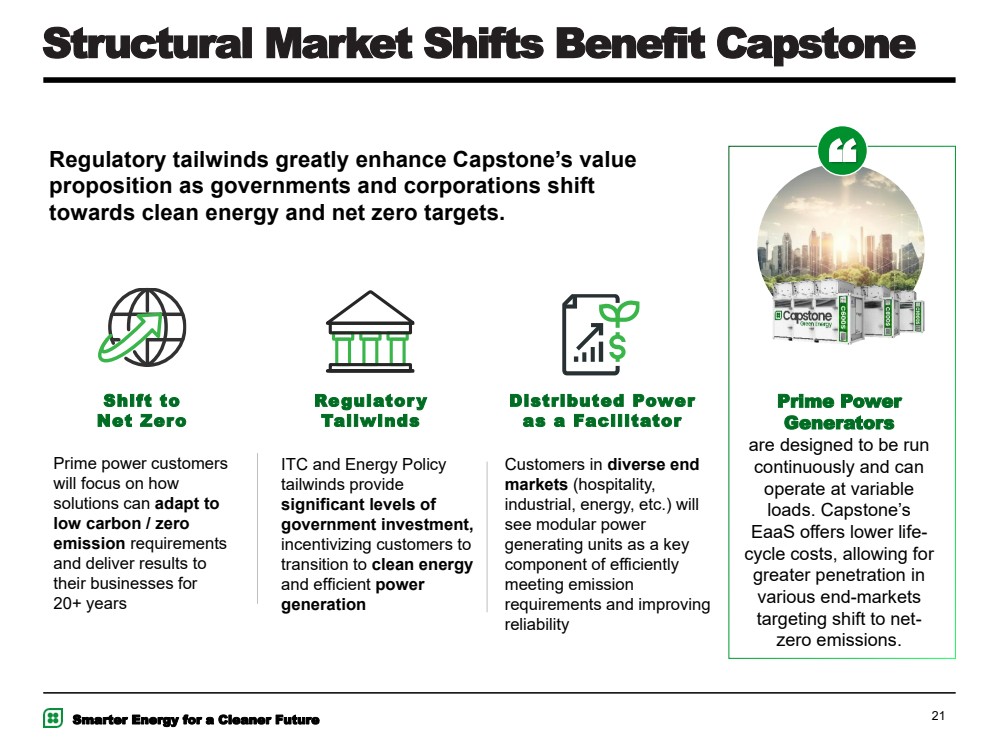
| Smarter Energy for a Cleaner Future Prime power customers will focus on how solutions can adapt to low carbon / zero emission requirements and deliver results to their businesses for 20+ years ITC and Energy Policy tailwinds provide significant levels of government investment, incentivizing customers to transition to clean energy and efficient power generation Customers in diverse end markets (hospitality, industrial, energy, etc.) will see modular power generating units as a key component of efficiently meeting emission requirements and improving reliability 21 Structural Market Shifts Benefit Capstone Shift to Net Zero Regulatory Tailwinds Distributed Power as a Facilitator Regulatory tailwinds greatly enhance Capstone’s value proposition as governments and corporations shift towards clean energy and net zero targets. Prime Power Generators are designed to be run continuously and can operate at variable loads. Capstone’s EaaS offers lower life-cycle costs, allowing for greater penetration in various end-markets targeting shift to net-zero emissions. “ |
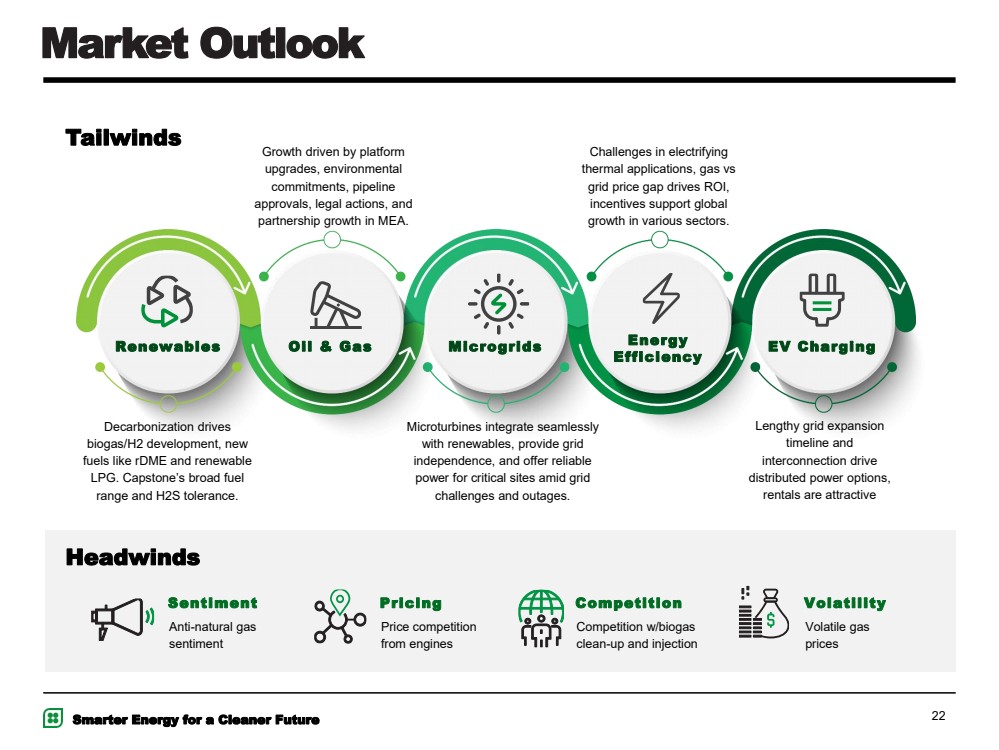
| Smarter Energy for a Cleaner Future 22 Market Outlook Renewables Oil & Gas Energy Efficiency Microgrids EV Charging Decarbonization drives biogas/H2 development, new fuels like rDME and renewable LPG. Capstone’s broad fuel range and H2S tolerance. Challenges in electrifying thermal applications, gas vs grid price gap drives ROI, incentives support global growth in various sectors. Growth driven by platform upgrades, environmental commitments, pipeline approvals, legal actions, and partnership growth in MEA. Lengthy grid expansion timeline and interconnection drive distributed power options, rentals are attractive Microturbines integrate seamlessly with renewables, provide grid independence, and offer reliable power for critical sites amid grid challenges and outages. Tailwinds Anti-natural gas sentiment Price competition from engines Competition w/biogas clean-up and injection Sentiment Pricing Competition Volatility Volatile gas prices Headwinds |
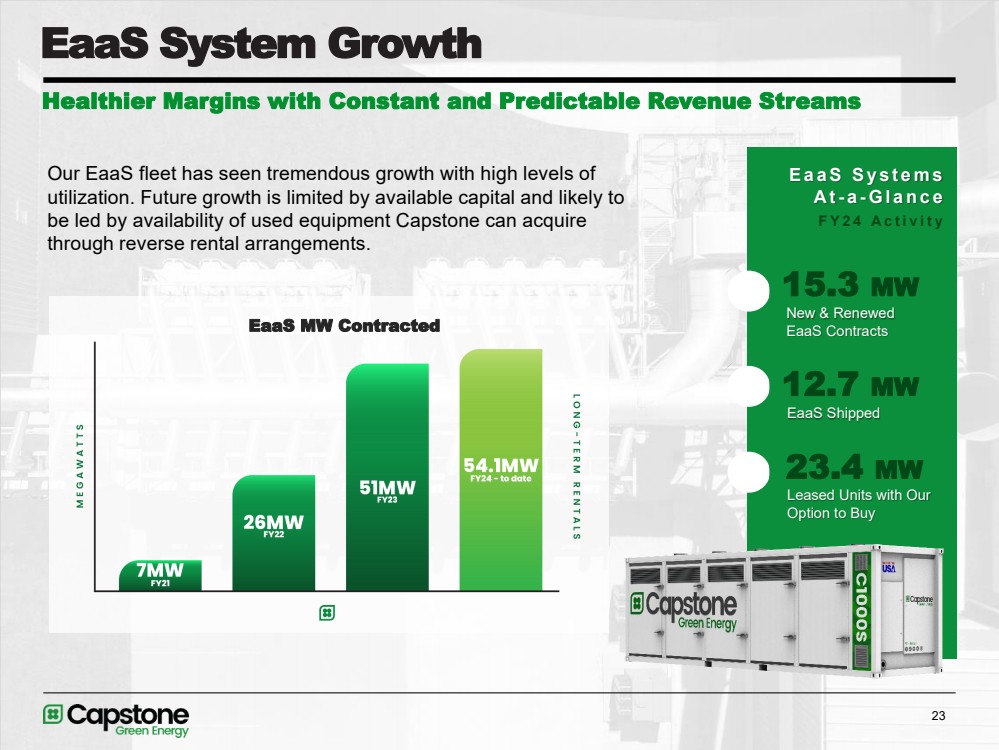
| Smarter Energy for a Cleaner Future 23 EaaS System Growth Healthier Margins with Constant and Predictable Revenue Streams E a a S S y s t e m s A t- a -G l a n c e F Y 2 4 A c t i v i t y 15.3 MW New & Renewed EaaS Contracts 12.7 MW EaaS Shipped 23.4 MW Leased Units with Our Option to Buy Our EaaS fleet has seen tremendous growth with high levels of utilization. Future growth is limited by available capital and likely to be led by availability of used equipment Capstone can acquire through reverse rental arrangements. EaaS MW Contracted |
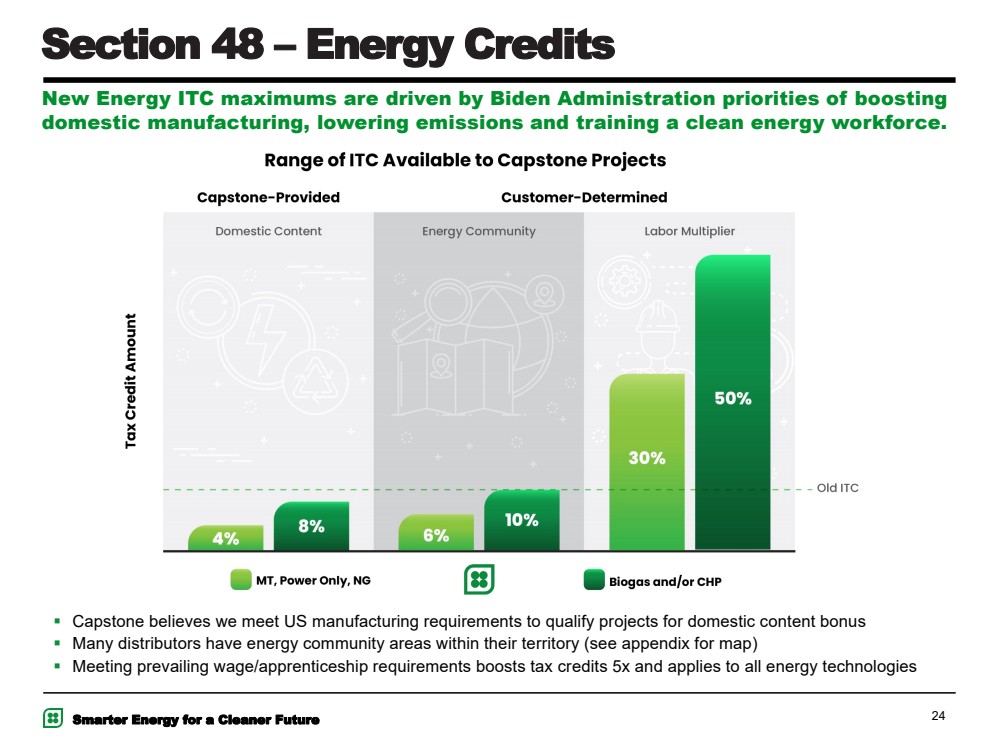
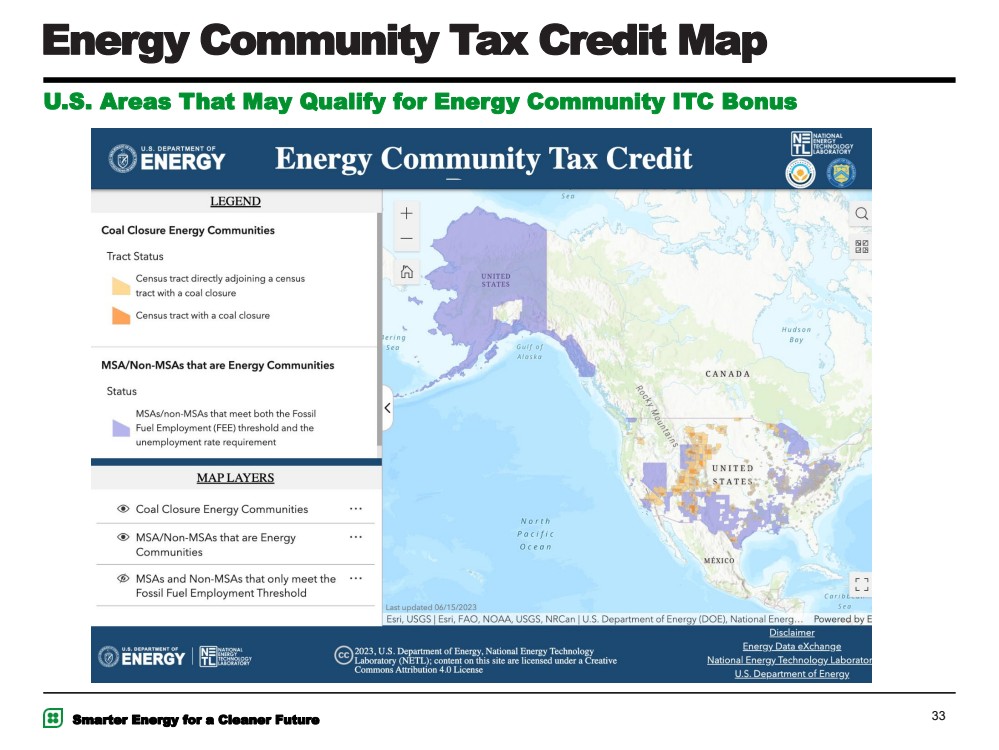
| Smarter Energy for a Cleaner Future 24 Section 48 – Energy Credits ▪ Capstone believes we meet US manufacturing requirements to qualify projects for domestic content bonus ▪ Many distributors have energy community areas within their territory (see appendix for map) ▪ Meeting prevailing wage/apprenticeship requirements boosts tax credits 5x and applies to all energy technologies New Energy ITC maximums are driven by Biden Administration priorities of boosting domestic manufacturing, lowering emissions and training a clean energy workforce. |
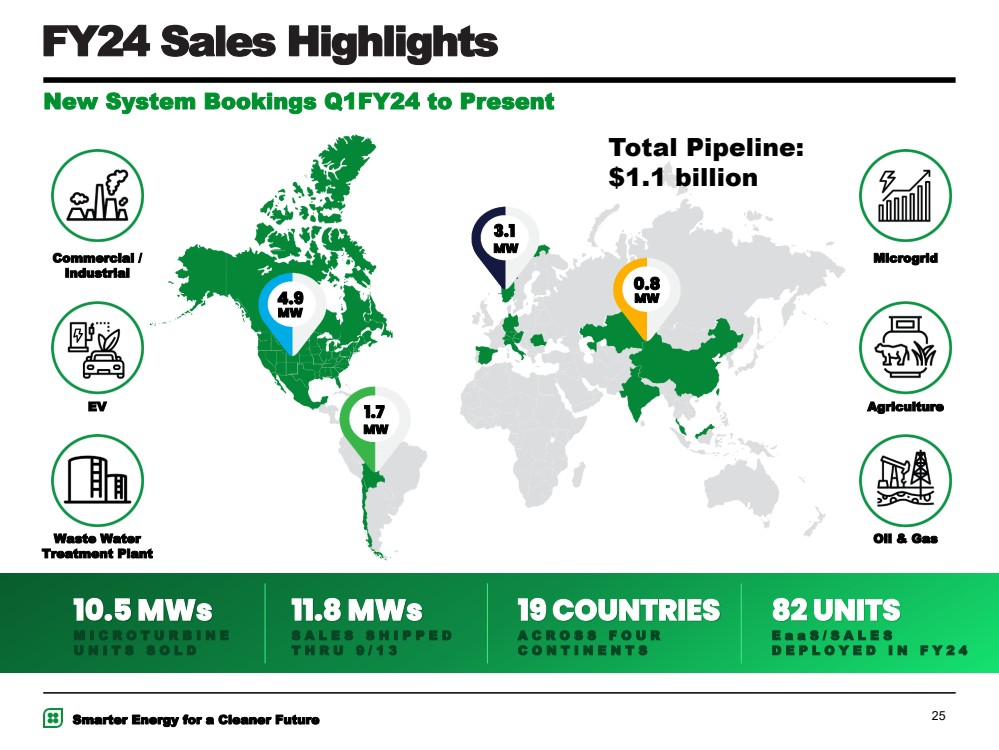
| Smarter Energy for a Cleaner Future 25 FY24 Sales Highlights New System Bookings Q1FY24 to Present S A L E S S H I P P E D T H R U 9 / 1 3 11.8 MWs E a a S / S A L E S D E P L O Y E D I N F Y 2 4 82 UNITS A C R O S S F O U R C O N T I N E N T S 19 COUNTRIES M I C R O T U R B I N E U N I T S S O L D 10.5 MWs Commercial / Microgrid Industrial EV Agriculture Waste Water Oil & Gas Treatment Plant 1.7 MW 0.8 MW 3.1 MW 4.9 MW Total Pipeline: $1.1 billion |
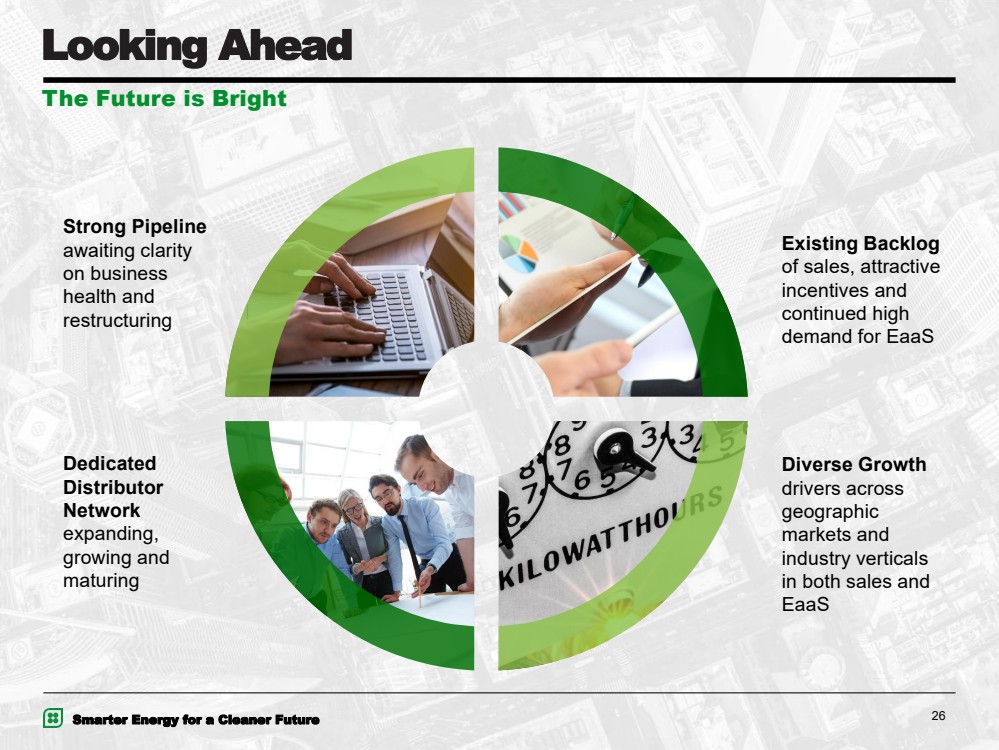
| Smarter Energy for a Cleaner Future 26 Looking Ahead The Future is Bright Strong Pipeline awaiting clarity on business health and restructuring Dedicated Distributor Network expanding, growing and maturing Existing Backlog of sales, attractive incentives and continued high demand for EaaS Diverse Growth drivers across geographic markets and industry verticals in both sales and EaaS |
| Smarter Energy for a Cleaner Future Going Forward 27 Robert Flexon Executive Chairman Interim President & Chief Executive Officer |
| Smarter Energy for a Cleaner Future 28 Building a Better Future ▪ Financial Restructuring ▪ Q3FY24 emergence ▪ Balance sheet and liquidity management ▪ Operational Restructuring ▪ Building efficiency by redesigning our business processes ▪ Resiliency and reliability of our business ▪ Better serving our stakeholders ▪ Organizational Restructuring ▪ Improving alignment of our people resources ▪ Investing in our employees’ development |
| Smarter Energy for a Cleaner Future Q&A |
| It seems to me we have a lot of story yet to tell Walt Disney “ “ |

| Smarter Energy for a Cleaner Future Appendix 31 |

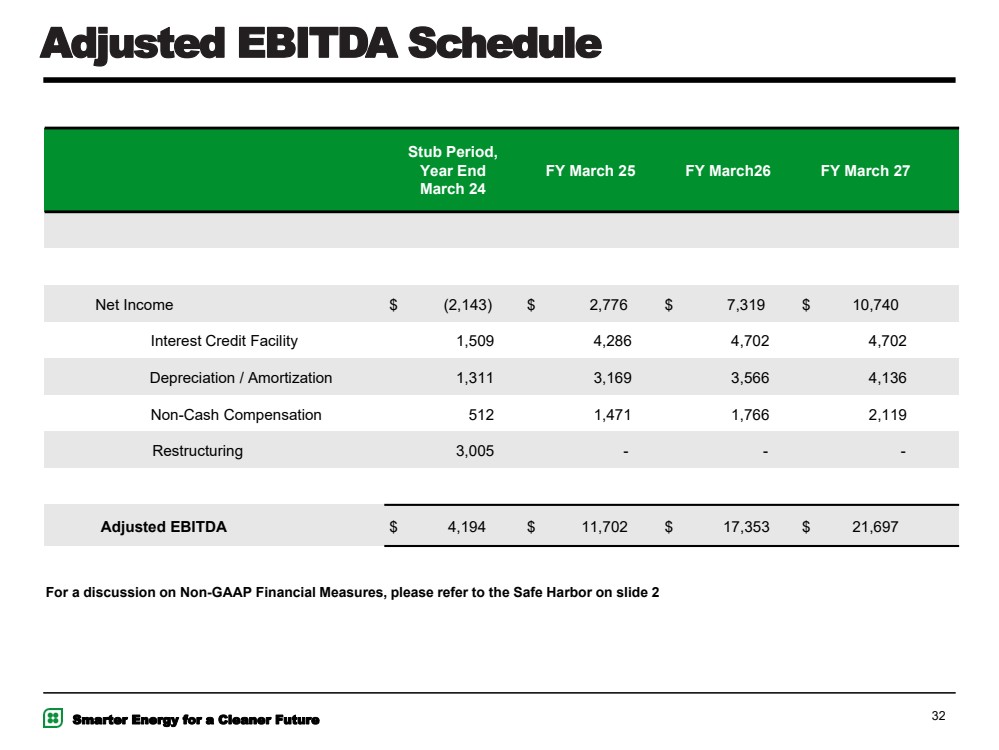
| Smarter Energy for a Cleaner Future 32 Adjusted EBITDA Schedule Stub Period, Year End March 24 FY March 25 FY March26 FY March 27 Net Income $ (2,143) $ 2,776 $ 7,319 $ 10,740 Interest Credit Facility 1,509 4,286 4,702 4,702 Depreciation / Amortization 1,311 3,169 3,566 4,136 Non-Cash Compensation 512 1,471 1,766 2,119 Restructuring 3,005 - - - Adjusted EBITDA $ 4,194 $ 11,702 $ 17,353 $ 21,697 For a discussion on Non-GAAP Financial Measures, please refer to the Safe Harbor on slide 2 |
| Smarter Energy for a Cleaner Future 33 Energy Community Tax Credit Map U.S. Areas That May Qualify for Energy Community ITC Bonus |
| Smarter Energy for a Cleaner Future “ Time to take the power in your hands. 16640 Stagg Street | Van Nuys, CA | 91406 USA www.capstonegreenenergy.com Thank you for your time! |